How to Improve Website UX with Doors Diagram
Information visualization helps websites to increase retention, conversions and other metrics that may suffer from design flaws. Using the Doors Diagram to visualize a process of a user passing all the way from the starting point to the final goal could help us correct these user experience issues. This diagram is much like a tool in service design, such as customer journey maps and others. Here, we’ll take a look at how it works.
Doors Diagram
Knowledge visualization includes various visual formats — sketches, diagrams, images, objects, etc. In talking about conceptual diagrams, there are different ways to use Gantt, Ishikawa, value chain, Mindmap, tree, flowchart, Sankey, critical path method, five forces, barchart, piechart, and others as tools of knowledge management to analyze and make strategic decisions.
Implementing diagrams in service design (the activity of planning and organizing infrastructure, communication and material components of a service in order to improve its quality and the interaction between service provider and users) helps to inform changes to an existing service. Doors Diagram is an example of a process diagram and is particularly focused on web-services.
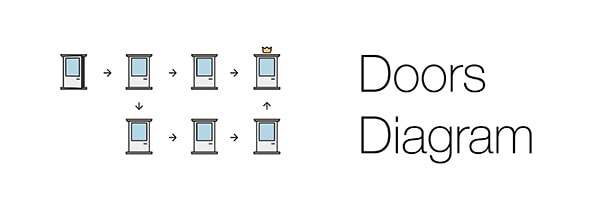
The logic behind Doors Diagram is pretty simple. A user is located somewhere on a website, what a user has done helps create steps toward a location, then comes in (similar to entering through a door) and then deciding where to go next. This spot is called a starting point (start) and is shown by an open door. At this moment the user sees more doors (or just one).
A starting point on a website may be a landing page, a profile page, or other similarly designed page.
With Postcards Email Builder you can create and edit email templates online without any coding skills! Includes more than 100 components to help you create custom emails templates faster than ever before.
Free Email BuilderFree Email Templates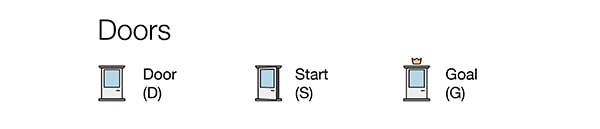
Then the user defines where to go — that is a goal. The goal is drawn with a crown above the door. It could be the next door just after the starting point. Or there might be series of different doors that will eventually lead to the goal.
Some examples of goals on a website are:
- To find out what the site is about
- To register
- To buy something
- To contact someone
- To download something
Such route from the starting point to the goal (or a door that seemed to be one) is called a corridor. Corridors vary in length depending on how many doors are presented on the route.
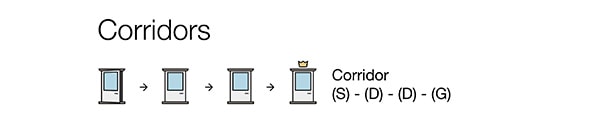
Every door represents an informational element — text, button, link, line, figure, whitespace or even the absence of any object.
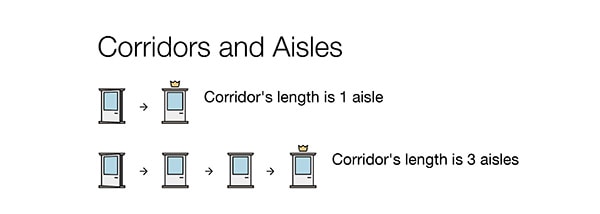
A passage from one door to another, including movements from a starting point to a door and from a door to a goal, is called an aisle. Every aisle is a transition from one element to another — click, scroll, wait.
With Startup App and Slides App you can build unlimited websites using the online website editor which includes ready-made designed and coded elements, templates and themes.
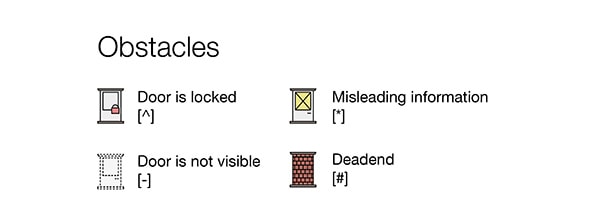
Try Startup App Try Slides AppOther ProductsOn the route there are also obstacles — UX bugs, mistakes, broken links, hidden buttons — that prevent users from reaching the goal.
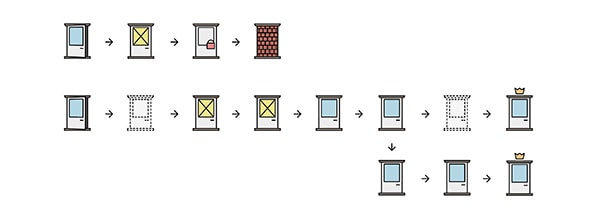
All in all there are four obstacles:
- [^] a door is locked (depicted with a red lock)
- [*] a door has misleading information (depicted with a yellow sticker on glass and a star is like the one in common terms and conditions)
- [-] a door is not visible (depicted with dotted lines)
- [#] a door is a dead end (depicted with bricks)
Achieving the goal may require more than one attempt, that means a user starts at the starting point but ends with a dead end. And the user needs to start all over again. That’s why there could be several processes from the starting point to the final goal or the dead end. Every such attempt is a separate corridor.
Here come some tips to remember:
- The more corridors there are (especially with deadends), the more a user is frustrated
- With increased numbers of doors (long corridors), the user’s happiness decreases
Example: Dribbble
The first case to pass through a prism of Doors Diagram is Dribbble.
A starting point is a user has just signed up and is located on Dribbble’s main page.
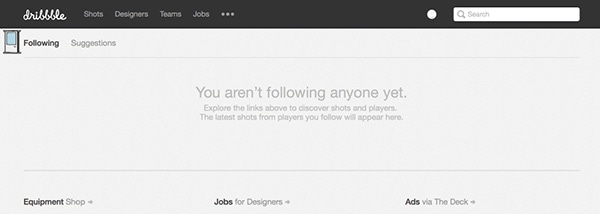
The starting point in Doors Diagram, Dribbble’s main page.
To define the goal imagine this user read the “How to Predict Web Design Trends” article and decided to explore Dribbble. Now the user has found what Dribbble is about (the About page says it is “show and tell for designers”), so the goal is to view a piece of design (Dribbble’s “to tell”), to ask something or simply leave some comments (this explains user’s registration as only registered users are able to comment).
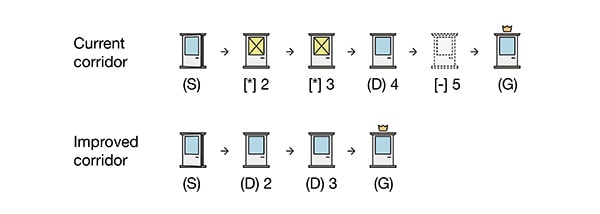
Below is the final Doors Diagram showing the route for a user to comment designers’ works (this one is oversimplified to get introduced to the concept). It is what we get after the full analysis of user’s actions.
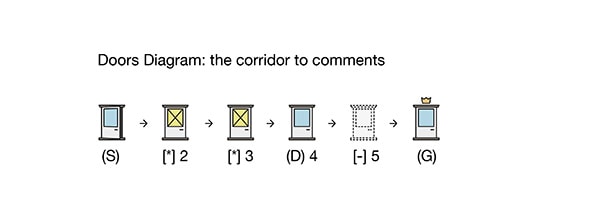
Now we start building this diagram.
[*] 2: Explore Links
A user sees the words “You aren’t following anyone yet. Explore the links above to discover shots and players. The latest shots from players you follow will appear here.” The text is the main message on this page, therefore the supposed call-to-action is to go through it.
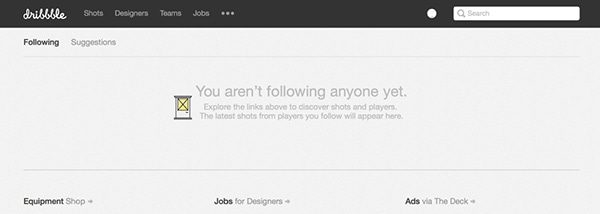
A user notices the verb “Explore” and decides that it is a link.
It misleads.
What to improve: add an active link to the words “Explore the links.”
[*] 3: Suggestions
The next step is to make a move. The user thought “explore the links above” refers to two tabs right above the text, which are “Following” (current one) and “Suggestions.” So the user makes a move and clicks on the second tab as it follows the logic — to discover any designers’ works you need to view what is suggested to you.
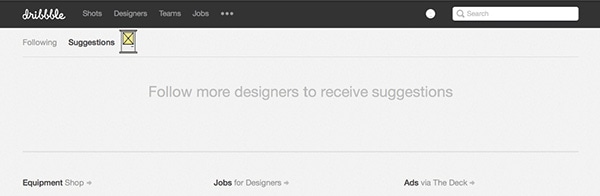
But this suggestions page displays: “Follow more designers to receive suggestions.” That means that the page doesn’t fully fulfill its function and doesn’t always show what it is supposed to show. It misleads.
What to improve: Even if a user doesn’t follow anyone, it’s worth showing in the Suggestions tab some suggestions, such as popular shots.
(D) 4: Straight to Shots
So the user makes another attempt and clicks on the upper row of links that are above “Following” and “Suggestions” (which were above the text “Explore the links above”). It could be either “Shots” or “Designers” — both lead to a shot in one click. So the user is now on a shot’s page.
[-] 5: Impossible to Leave Comments
When scrolling down to the last comment the user expects to find a form to leave a new comment. But this form is absent.
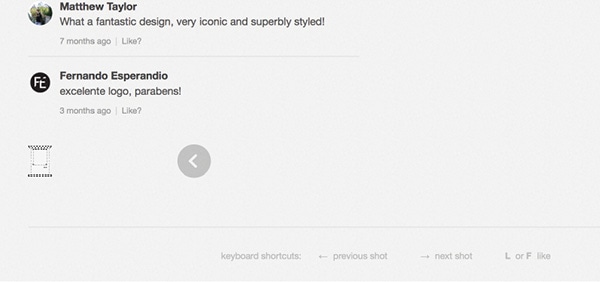
Example of the last comment.
It is not evident why a new user can’t comment and where it is written. And the hidden invisible path is to go to “Help” then to “Shots and Comments,” where finally the answer to the question “How can I leave comments on shots?” is.
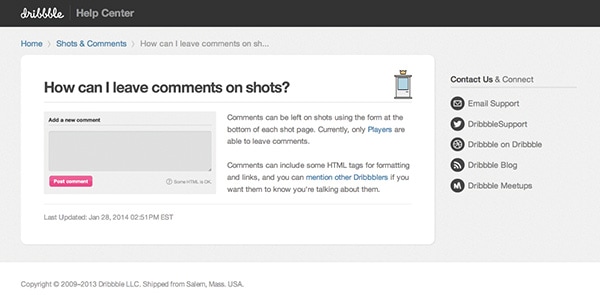
This could be the last step before the final goal because to comment on shots one needs to be a Dribbble Player, which is not that easy. But the entire corridor should definitely be optimized.
What to improve: Place a note that “only players are able to leave comments” (also with a link) right under the last comment in a thread.
(G): Results
All in all it took five aisles for the user to reach the goal. The ideal corridor length could be estimated as equal to two or three aisles.
Conclusion
The aim of the Doors Diagram is to help to get users as fast as possible from where they are right now to where they want (or are expected) to go without any obstacles and extra moves.
How to use Doors Diagram:
- Define where a user is and set a starting point.
- Set a goal.
- Start moving the user like playing chess.
- Identify every door the user enters and every aisle the user passes.
- Write down what can be improved for each obstacle.
- Draw the entire diagram.
- See which elements can be eliminated to make the corridor shorter.
- Compare the result with other Door Diagrams.
The Doors Diagram has advantages (easy-to-use, accessible information, vivid actions to take) and disadvantages (due to losing the freshness of vision it needs an outsider to design or to use approaches like mystery shopping) and, as a visualization tool, goes well with other service design tools.