Showcase of Annual Report Design Trends
Now that 2013 is in the books, many companies are releasing annual data reports. From annual reports to a year in review documentation, company reports are likely an important resource for your company, investors and clients.
So how do you make the most of that information? Good design, of course.
Whether you opt for a paper report or digital report or both, a stellar look will make your numbers and company profile that much more appealing. Today, we will look at a few nicely done reports and what you can take away from them when creating documentation of your own.
2013 Trends
The annual report, a staple of the corporate world, has really undergone a transformation of sorts in recent years. Most notably, reports are going paperless. From website reports to PDF-only reports, fewer companies are printing.
This makes creating a report less pricey, easier to distribute and allows for a little more creativity in design. Video, animated effects and parallax scrolling techniques, for example, are popular options for some of this year’s best examples.
In a recent survey by Savage Brands, most companies reported using a combination of both printed and digital formats for their annual reports. Only 7 percent of companies surveyed used a print-only report. In addition to flexibility, online reports also provide another bonus, tracking tools; a feature that has increased more than 60 percent in the last five years.
With Postcards Email Builder you can create and edit email templates online without any coding skills! Includes more than 100 components to help you create custom emails templates faster than ever before.
Free Email BuilderFree Email TemplatesDesign trends are also very visible in this year’s reports. Most notably, flat design and bold color choices are hard to miss and create a quite impactful report. Infographics are also replacing some of the text-only reports we have seen in the past as well.
Characteristics of a Great Report
A great report does a few distinct things.
For the company, it outlines what happened in the past year and is a good way to review accomplishments and challenges. It can help you set goals for the upcoming year as well.
For investors and clients, it is a way to connect with someone you do business with. What worked in the business relationship, what did not, what’s coming up in the next year?
The report should showcase those highlights in a digestible format. While more annual reports are filled with numbers, these need to be broken down into bits of information that make sense to the general public, especially for reports that are publically available for viewing or download.
With Startup App and Slides App you can build unlimited websites using the online website editor which includes ready-made designed and coded elements, templates and themes.
Try Startup App Try Slides AppOther ProductsFinally, to get users to engage with the report it needs to be visually appealing. What’s great about so many of the reports featured here is that the showcase some of the biggest design trends of the year. Iconfinder uses a simple flat design scheme with big numbers and bold color. Mailchimp employs a fun parallax scrolling technique with bold type and color. Vimeo showcases plenty of neat animations in a graphic-style design. Kickstarter even shows of a successful project in video format.
2013’s Top 10
While there are a lot of great annual reports floating around out there (and some not-so-great ones as well), we will highlight 10 of the year’s best reports and what makes each really stand out.
Make sure to visit the site of each to get the full scope of the different types of reports. Here they are in no particular order:
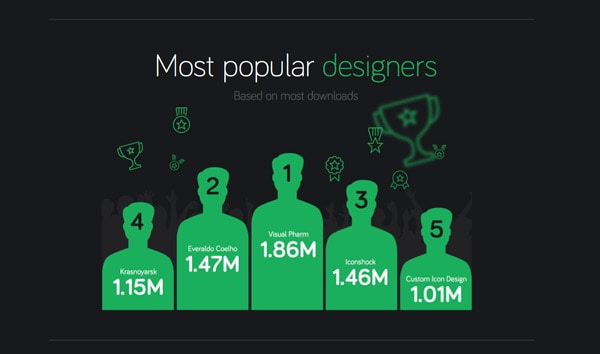
Iconfinder
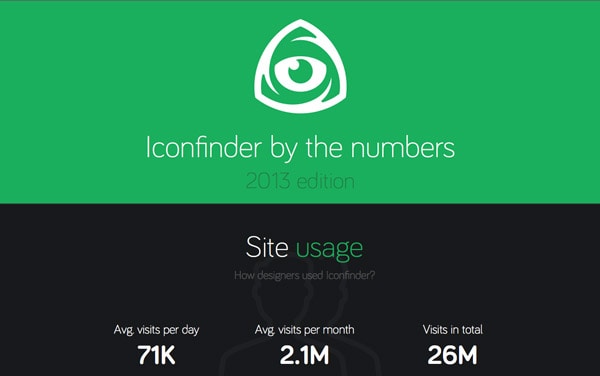
There’s no doubt that flat was the “it trend” of 2013 and Iconfinder does a great job of playing up bold color and type with a flat annual report outline. The simple design is visually pleasing and with every scrolled “page,” you get a better feel for what the company has done, who they are and where they are going.
Shopify
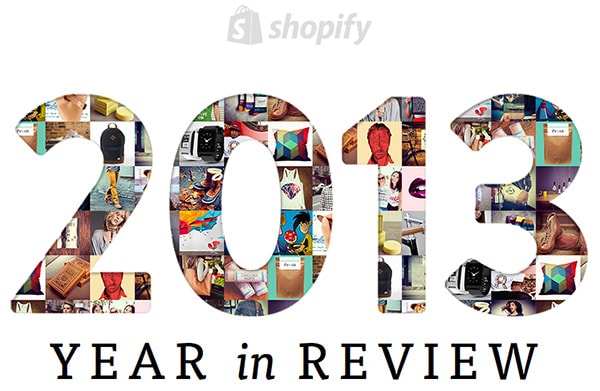
The minimalistic style of the Shopify report is one of the cleanest ways to distribute a massive amount of information. From numbers to partners, this report is jam-packed with information but is designed to create a light and easy read. Through the site are fun, simple animations that really help the numbers shine in each of the infographics. This really is the way to compile a lot of information in a digestible format.
Microsoft

What’s nice about the Microsoft report is that it really plays up the design scheme it became famous for this year, with a combination of flat and metro styling. The report is highly visual and includes an almost hidden navigation menu (top right corner). Inside the navigation is everything you would expect to get from a major corporate report, organized neatly and in a somewhat traditional format.
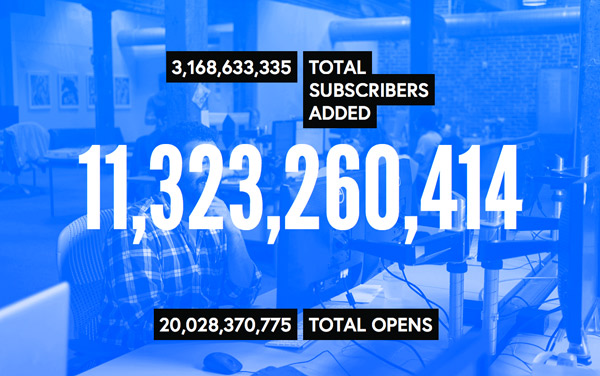
MailChimp
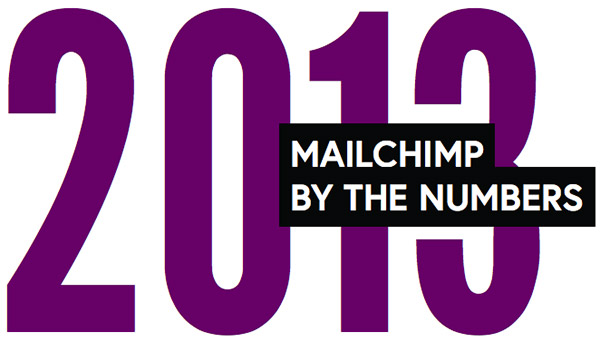
For the past few years, MailChimp has been one of the leaders in the year in review website. This company gets it in terms of visual style and organization. The parallax scrolling techniques here are spot on as is the simple language and images used to show off the year’s work. The emphasis on big numbers – take note of how the presentation is ordered from smallest numbers to largest – adds extra emphasis to the design techniques used.
Pingdom
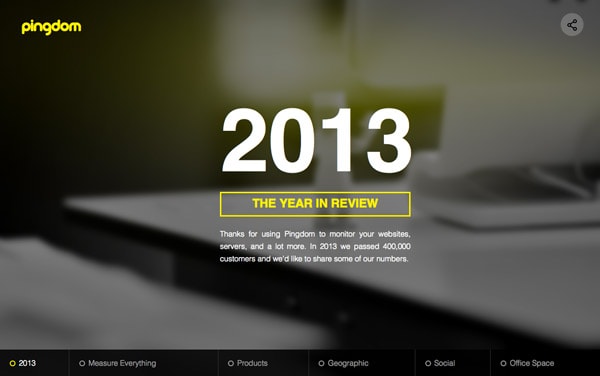
This report combines several of the big design trends of the year – flat and metro design, parallax and large typography. The result is a clean, fun to scroll through site. What’s especially nice about a site with this much scrolling (the site is pretty robust) is the static navigation bar at the bottom of the screen. You might even miss it if you are into the effects, but it provides a great way to skip to the sections you want to see most.
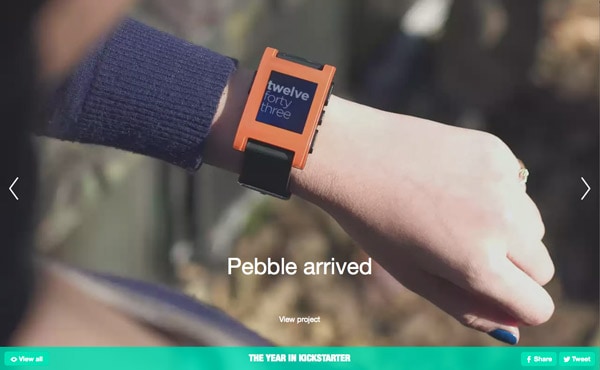
Kickstarter
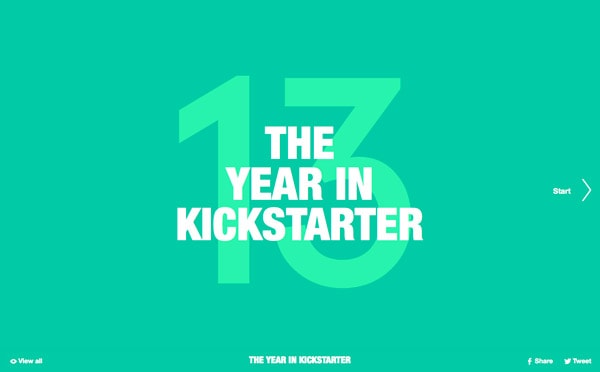
Video is what makes this report stand out. Kickstarter used simple and short video clips to show users some of the best and most successful products of the year. The result is an annual report that is anything but boring and makes me want to “buy it now!” Seems like a good tactic to generate buzz and continued company support.
Nikon (PDF)
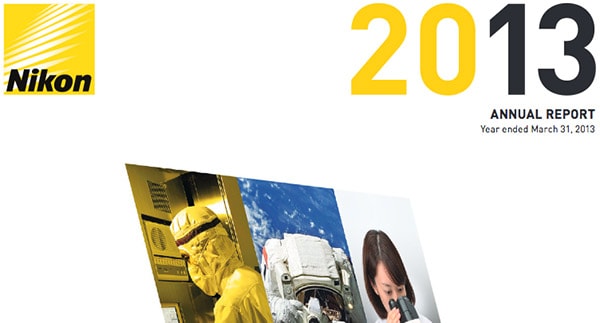
While Nikon’s report is a little more tradition than some of the others – the company opted for a PDF report – it still has a great overall look. It is highly graphical and uses a lot of bold color and flat styling. If you are planning a report that has a lot of numbers and need organization pointers, this is the place to look.
Simple
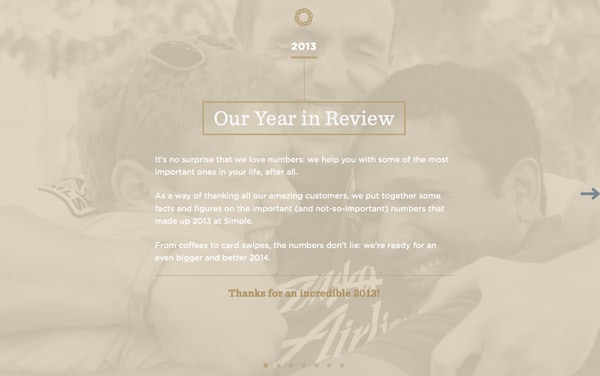
The simple slider to showcase Simple’s year is perfect appropriate. The report makes you want to stop and look, from the use of color to simple and beautiful type combinations to almost hidden background images that pull it all together. The idea that a company with the name Simple created such a simple report is also fantastic.
Warby Parker
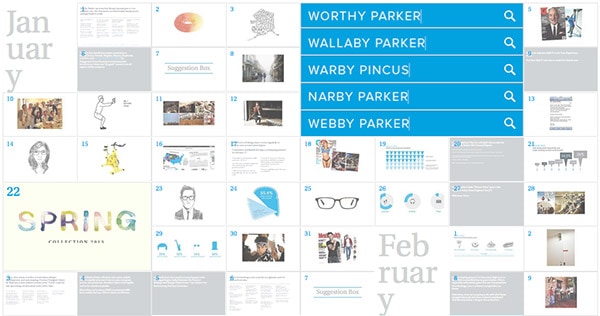
This might just be the most complex and amazing infographic I have seen all year. Warby Parker turned the entire company year into a giant graphic timeline of accomplishments and highlights. The calendar-style report is fun to click through with a combination of data, news-style snippets and images. I could spend hours clicking through all of the information on this page.
Vimeo
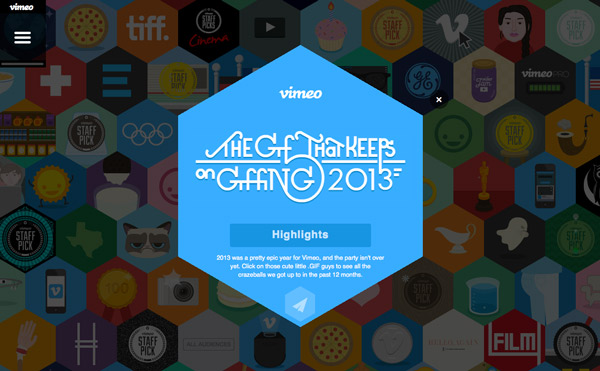
At first glance, you might wonder how long it took Vimeo to create all of the icons and divots on this page, but then you get pulled in to looking at them. Each icon is a clickable moment from the year and contains video (which the company is known for), text, images, animations and highlights. The effect is pretty stunning and is one of the few examples of lots of effects used together in a way that actually works.
Conclusion
Even though we are a month into the new year, it’s not too late to design your year-end report. Or if you company runs on a fiscal year cycle, make sure to bookmark this page and come back when your numbers are ready in June or July.
Have you seen other great examples of reporting? It can be a tough type of design. But we’d love to see what you are doing. Share your reports with us in the comments.