Email Marketing Benchmarks by Industry for 2026
Email marketing benchmarks are average performance metrics such as open rates and click-through rates, calculated from email campaigns. They show what “typical” email performance looks like for businesses like yours.
This context is quite important for marketers because email volume is high. In 2026, 392.5 billion emails are expected to be sent every day. With inboxes this crowded, small differences in performance can create meaningful differences in leads, revenue, or retention.
In this guide, we break down email marketing benchmarks by industry and explain the key metrics you should use to evaluate your own email results.
Why Benchmarks Are Important in Email Marketing
Email marketing benchmarks tell you whether your results are strong, average, or underperforming compared to similar businesses. They give concrete meaning to metrics like open rates and click-through rates by adding industry context.
Without benchmarks, individual numbers are easy to misread.
For example, a 24% open rate might seem low or high depending on your expectations, but on its own, it doesn’t tell you much.
With Postcards Email Builder you can create and edit email templates online without any coding skills! Includes more than 100 components to help you create custom emails templates faster than ever before.
Free Email BuilderFree Email TemplatesNow add industry context: if you run a B2B SaaS newsletter and the industry benchmark open rate is around 22%, a 24% open rate means your emails are performing slightly above average.
By comparing email performance across campaigns, audiences, or formats, you can identify which emails need improvement and optimize based on evidence.
What Are the Key Metrics of B2B Email Marketing You Should Track
The key b2b email marketing metrics to track are:
- Open rate
- Click-through rate
- Click-to-open rate
- Unsubscribe rate
- Bounce rate
Together, these metrics show whether your emails are reaching inboxes, attracting attention, and driving action.
Open Rates
Open rate shows how many people opened your email. It is calculated by dividing the number of opens by the number of delivered emails.
This rate gives a basic signal of how effective your subject lines and sender name are. However, it is no longer a fully reliable engagement metric. Apple Mail Privacy Protection can register emails as opened even if the recipient never reads them, which can inflate open rates, especially for audiences using Apple Mail.
Because of this, open rate works best as a directional metric. Use it to track trends over time, not to measure true interest or content performance.
Click Through Rate
Click-Through Rate (CTR) shows the percentage of recipients who clicked at least one link in your email. It is calculated by dividing total clicks by the number of delivered emails.
With Pulsetic you’ll be instantly notified the moment your website, API, or server becomes unavailable. Monitor uptime from multiple global locations and respond to incidents before your users are affected.
Create beautiful status pages in minutes to keep customers informed during outages and build trust with transparent communication.
Start Monitoring for FreeA click indicates that the reader found the message relevant enough to take action, which makes CTR more meaningful than open rate for evaluating content performance.
To improve CTR, focus each email on one primary action, make links visually clear, and ensure calls to action are easy to tap on mobile devices.
Click to Open Rate
Click-To-Open Rate (CTOR) measures how many people clicked a link in an email after opening it. It compares clicks to opens rather than to total deliveries.
You can track this to see whether the message, layout, and call to action convinced readers to act upon opening the email.
Unsubscribe Rate
Unsubscribe rate shows the percentage of recipients who opted out of your list after receiving an email.
A consistently low unsubscribe rate indicates that your content and sending frequency align with audience expectations. Rates below 2% are generally considered healthy for B2B email programs.
Although some unsubscribes are normal, sudden spikes often signal that your email messaging or frequency does not align with your target audience’s needs.
Bounce Rate
Bounce rate measures the percentage of emails that were not successfully delivered.
There are two types of bounces:
- Hard bounces, which occur when an email address is invalid or no longer exists
- Soft bounces, which occur due to temporary issues such as a full inbox or server problem
Keeping bounce rates below 2% protects your sender reputation and improves overall email deliverability.
👉 Check the latest stats and trends: Email Deliverability Report
Email Marketing Benchmarks by Industry
Email marketing benchmarks vary by industry, which is why performance metrics only make sense when you compare them against similar businesses. A “good” open rate or click-through rate in one industry may be average or even weak in another.
The data below shows average email marketing benchmarks by industry, based on aggregated 2025 data:
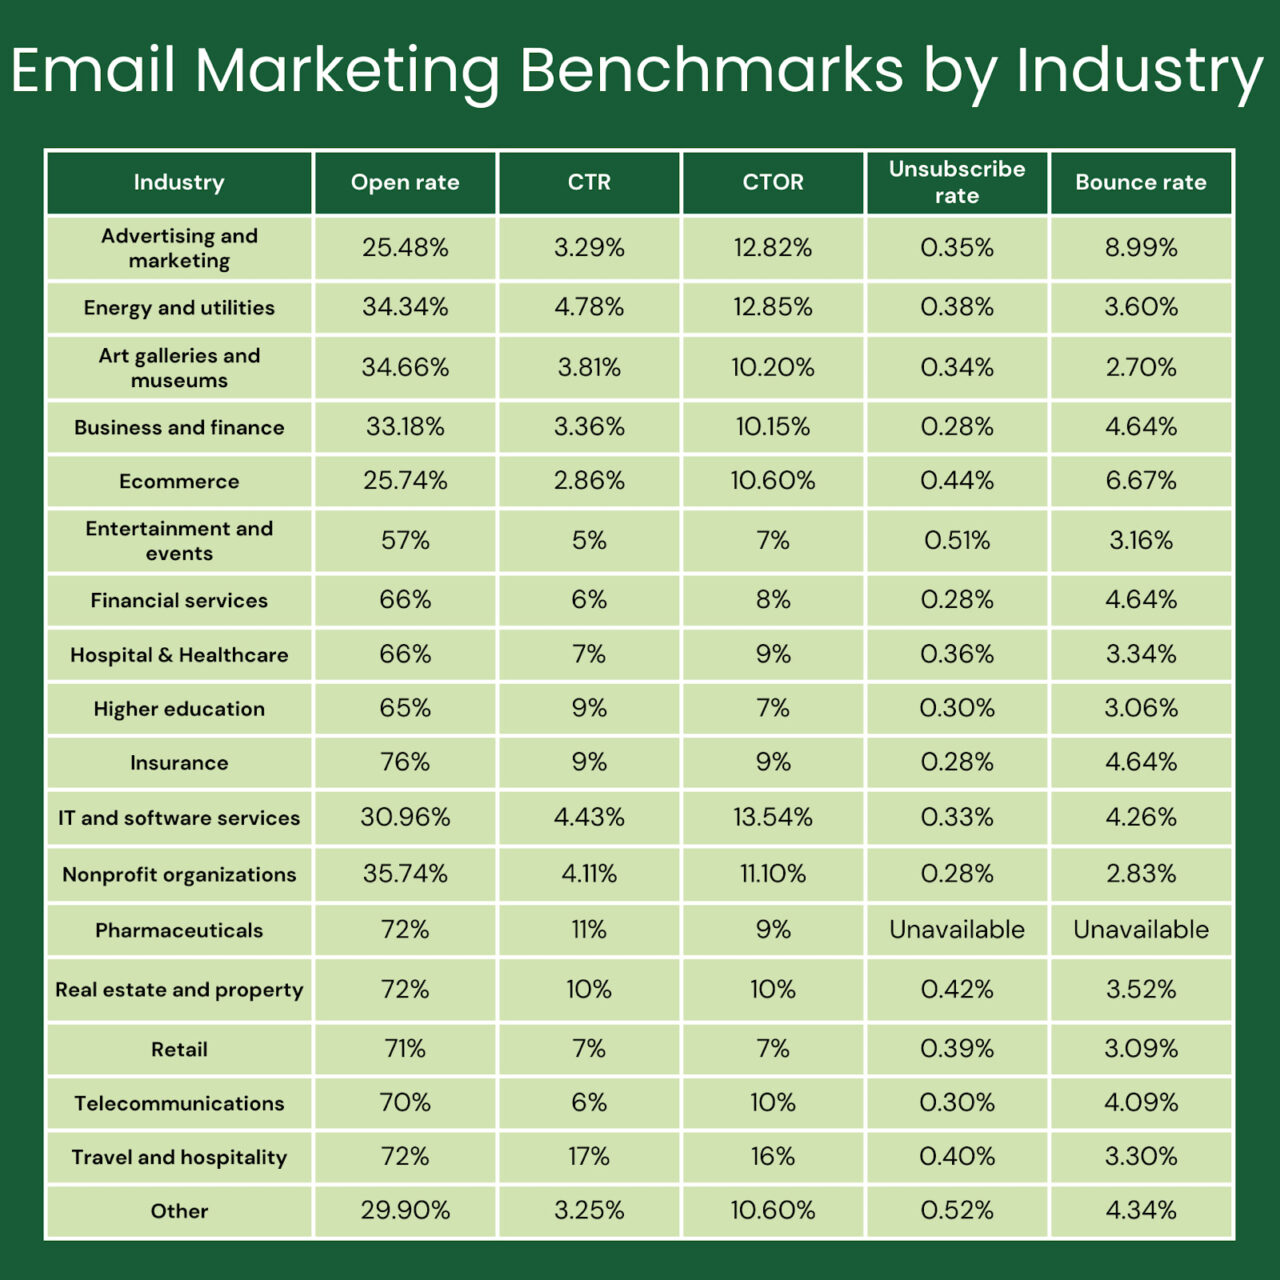
Advertising and Marketing
- Open rate: 25.48%
- Click-through rate: 3.29%
- Click-to-open rate: 12.82%
- Unsubscribe rate: 0.35%
- Bounce rate: 8.99%
Energy and Utilities
- Open rate: 34.34%
- Click-through rate: 4.78%
- Click-to-open rate: 12.85%
- Unsubscribe rate: 0.38%
- Bounce rate: 3.60%
Art Galleries and Museums
- Open rate: 34.66%
- Click-through rate: 3.81%
- Click-to-open rate: 10.20%
- Unsubscribe rate: 0.34%
- Bounce rate: 2.70%
Business and Finance
- Open rate: 33.18%
- Click-through rate: 3.36%
- Click-to-open rate: 10.15%
- Unsubscribe rate: 0.28%
- Bounce rate: 4.64%
Ecommerce
- Open rate: 25.74%
- Click-through rate: 2.86%
- Click-to-open rate: 10.60%
- Unsubscribe rate: 0.44%
- Bounce rate: 6.67%
Entertainment and Events
- Open rate: 57%
- Click-through rate: 5%
- Click-to-open rate: 7%
- Unsubscribe rate: 0.51%
- Bounce rate: 3.16%
Financial Services
- Open rate: 66%
- Click-through rate: 6%
- Click-to-open rate: 8%
- Unsubscribe rate: 0.28%
- Bounce rate: 4.64%
Hospital and Healthcare
- Open rate: 66%
- Click-through rate: 7%
- Click-to-open rate: 9%
- Unsubscribe rate: 0.36%
- Bounce rate: 3.34%
Insurance
- Open rate: 76%
- Click-through rate: 9%
- Click-to-open rate: 9%
- Unsubscribe rate: 0.28%
- Bounce rate: 4.64%
IT and Software Services
- Open rate: 30.96%
- Click-through rate: 4.43%
- Click-to-open rate: 13.54%
- Unsubscribe rate: 0.33%
- Bounce rate: 4.26%
Nonprofit Organizations
- Open rate: 35.74%
- Click-through rate: 4.11%
- Click-to-open rate: 11.10%
- Unsubscribe rate: 0.28%
- Bounce rate: 2.83%
Pharmaceuticals
- Open rate: 72%
- Click-through rate: 11%
- Click-to-open rate: 9%
- Unsubscribe rate: Unavailable
- Bounce rate: Unavailable
Real Estate and Property
- Open rate: 72%
- Click-through rate: 10%
- Click-to-open rate: 10%
- Unsubscribe rate: 0.42%
- Bounce rate: 3.52%
Retail
- Open rate: 71%
- Click-through rate: 7%
- Click-to-open rate: 7%
- Unsubscribe rate: 0.39%
- Bounce rate: 3.09%
Telecommunications
- Open rate: 70%
- Click-through rate: 6%
- Click-to-open rate: 10%
- Unsubscribe rate: 0.30%
- Bounce rate: 4.09%
Travel and Hospitality
- Open rate: 72%
- Click-through rate: 17%
- Click-to-open rate: 16%
- Unsubscribe rate: 0.40%
- Bounce rate: 3.30%
Other Industries
- Open rate: 29.90%
- Click-through rate: 3.25%
- Click-to-open rate: 10.60%
- Unsubscribe rate: 0.52%
- Bounce rate: 4.34%
These email marketing benchmarks are reference points, not performance targets. A higher number is not automatically better unless it aligns with your industry, audience, and email goals.
What You Can Do With Email Marketing Benchmarks
Identify the industry that most closely matches your business. Then compare your metrics to the benchmark range, not just the average. This tells you where you are performing as expected and where improvement will have the biggest impact.
Suppose you run a B2B software company and send a monthly product newsletter.
- Your open rate is 28%
- Your click-through rate is 2.5%
The industry benchmarks show:
- Average open rate: ~31%
- Average click-through rate: ~4.4%
In this case, your open rate is close to the industry average, which suggests your subject lines and sender reputation are working reasonably well. Your click-through rate, however, is noticeably lower than the benchmark.
That gap tells you where to focus.
Instead of trying to improve opens, prioritize clearer calls to action, tighter messaging, or better alignment between email content and landing pages, because clicks are where you are underperforming relative to similar businesses.
Using Benchmarks to Guide Decisions
You can use industry benchmarks to:
- Diagnose performance issues by identifying which metrics lag behind industry norms
- Set realistic expectations for stakeholders based on industry context, not assumptions
- Prioritize optimization efforts by focusing on the metrics that matter most for your email type
- Track progress over time by measuring movement toward or beyond benchmark ranges
What Affects Email Performance by Industry
Email performance varies by industry because audience expectations, sending habits, and content norms differ. These factors shape how often people open emails, click links, or unsubscribe, making industry benchmarks inherently uneven:
- Audience type: Some audiences expect frequent emails. Others prefer fewer updates. This directly affects opens and clicks.
- Send frequency: Industries that email often may see lower open rates over time. Industries that email less often tend to see higher open rates.
List quality: Clean and active lists lead to better delivery and engagement. Old or inactive lists increase bounces and unsubscribes. - Content type: Educational content works well in many B2B industries. But promotional content performs better in retail and e-commerce.
- Optimization practices: A/B testing your subject lines and personalization may improve open rates.
How B2B Email Metrics Compare to B2C
B2B and B2C emails perform differently because people read them for different reasons.
- B2B emails focus on learning, comparison, or problem-solving. Because of this, open rates are often higher, but clicks may take longer, as decisions are rarely made after a single email.
- B2C emails focus on offers, products, or quick updates. So, open rates may be lower, but clicks often occur more quickly because the goal is immediate action.
Engagement also means something different.
In B2B, even a small number of clicks can show strong interest. In B2C, higher click volume usually matters more.
When you read benchmarks, always match them to the type of email you are sending. This would help you focus on the metrics that actually reflect success for your audience.
Trends Shaping Email Benchmarks in 2026 and Beyond
Email benchmarks are changing, and the numbers you trusted before no longer mean the same thing.
Open rates are less reliable now because privacy tools can mark emails as opened even when they are not read. That’s why clicks and conversions are becoming more important than they used to be.
AI tools are also getting smarter: Many now adjust send times and content based on past behavior. This means results can vary widely, even within the same industry.
FAQs
What Are Good Stats for Email Marketing?
Good email marketing stats depend on your industry, but many campaigns perform well with open rates around 20–30% and click-through rates between 2–5%. However, industry benchmarks are more important than universal averages.
How Effective Are Email Marketing Stats?
Email marketing stats are effective when used to compare performance over time or against industry benchmarks. On their own, individual numbers can be misleading.
What Is the 80/20 Rule in Email Marketing?
The 80/20 rule in email marketing means that most results often come from a small portion of your emails or subscribers. Your most engaged audience segments usually drive the majority of opens, clicks, and conversions.
Is Email Marketing Dead or Not?
Email marketing is not dead. It remains one of the most reliable channels for engagement and conversions when messages are relevant and permission-based.
What Is an Impressive Email Open Rate?
An impressive email open rate is one that performs above your industry average.
Is a 20% Email Open Rate Good?
It depends on the industry you operate in. A 20% email open rate can be good in competitive or high-volume industries, but whether it is strong for your business depends on how it compares to your industry benchmark.