Creating a Scalable SVG Infographic
In this tutorial, I’m exploring how to make a scalable infographic in the browser using SVG as a graphical format. I’m also using CSS3 animation techniques to animate most elements. The subject of the infographic is “Population growth on this planet”. Preview the finished, animated infographic here:

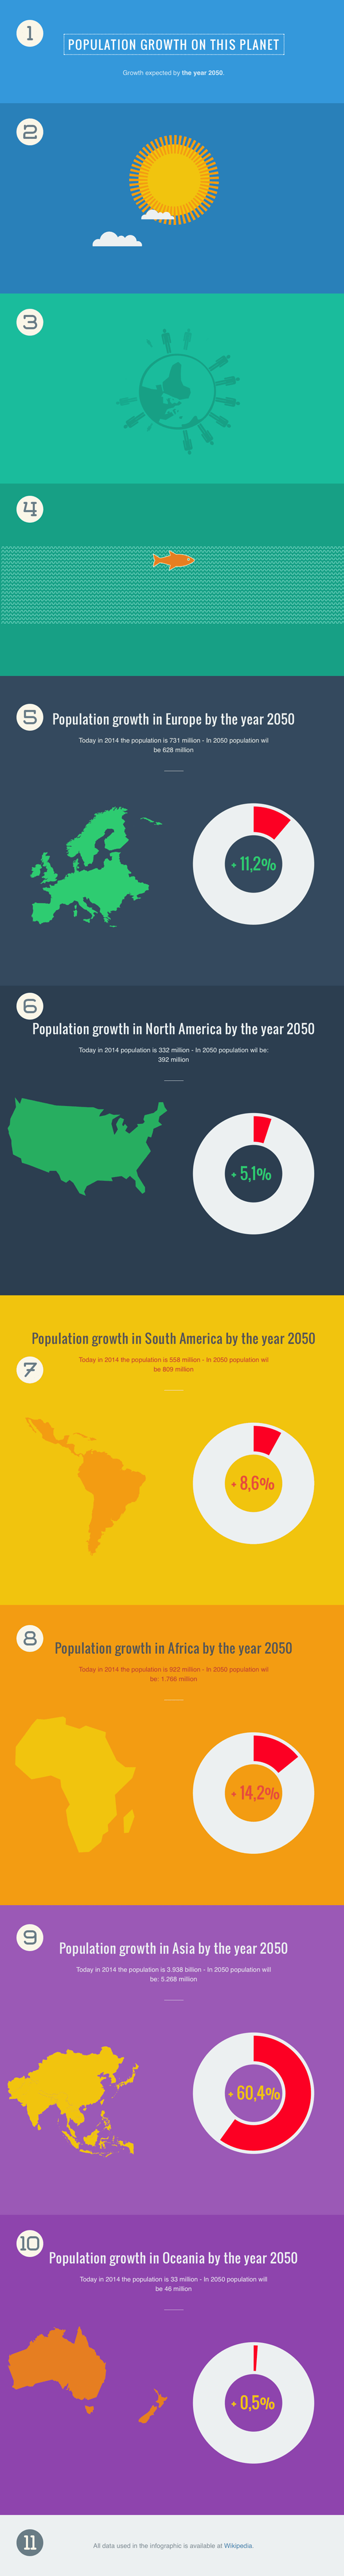
The scalable infographic is divided into 11 parts, from the title to the footer at the bottom. The first 3 sections are animations illustrating the subject of the infographic while the other 6 parts are the graphical representation of the 6 continents with an animated donut graph showing the growth percentage by the year 2050.
How to prepare for an infographic
Doing research for the correct data
Infographics are used everywhere on the internet. An infographic is very useful to explain bits of information that are not always easy to comprehend into graphics that explain in a simple and easy way the key points of the information blocks.
Preparation: before starting the infographic it’s important to do just enough research for collecting the data and collecting ideas for representing the data in an attractive way. I’m sure everyone does this research in his/her own way, my suggestion is to do a quick sketch first to be sure you have an overall idea of your infographic and to have a fallback while designing in the browser.
With Postcards Email Builder you can create and edit email templates online without any coding skills! Includes more than 100 components to help you create custom emails templates faster than ever before.
Free Email BuilderFree Email TemplatesInfographic research: be sure to present complex information quickly & clearly, structure the infographic and start with a title, visualize data that is relevant to the story, optimize illustrations for the targeted screens. Try to simplify as much as possible, limit the focus to just one area. An important step is to label time-sensitive data to keep the data credible and last thing is to optimize the infographic to make it shareable. For the purpose of this SVG infographic, i choose the subject “Population growth on this planet”. I collected my data from Wikipedia and shared the link at the bottom of my infographic.
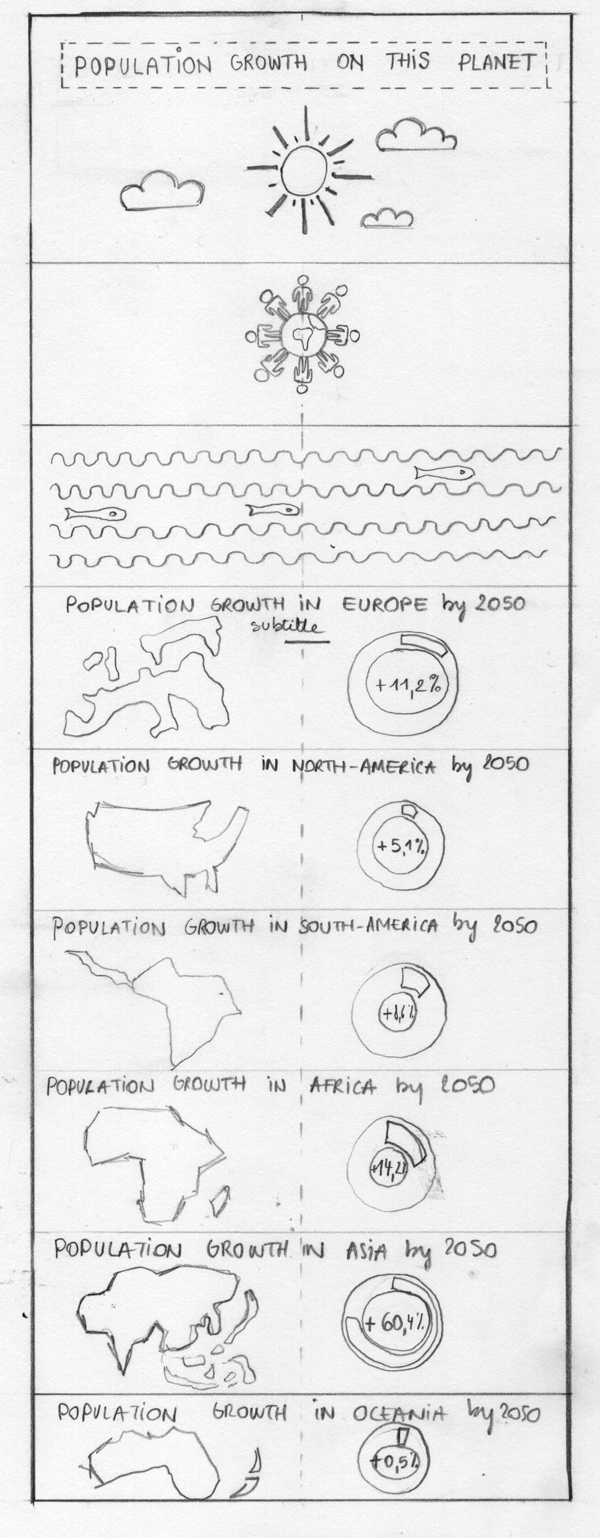
Sketch your initial idea for later usage and reference.
Why do i choose SVG as the graphic format?
Scalable and independent
SVG stands for scalable vector format. SVG is a resolution independent graphical format which means that you don’t have to serve up multiple versions of a given graphic to all of the different screens. And that is a huge time saver. Because SVG is recently being supported by all major and modern browsers, people will explore the world of SVG and will start to use it for more and more artwork. SVG is an open W3C standard and SVG allows for three types of graphic objects: vector graphic shapes, images and text.
Reading about the chosen technique
SVG in combination with CSS for animation
Once you decided on which technique you’ll use to accomplish your task, i recommend reading and finding online sources about it, for this specific tutorial, i started with a pocket guide and e-book written by Val Head and published by Five Simple Steps: CSS animations. I want to keep the animations simple and tried to code as much as possible with CSS. In this pocket book, CSS animations are explained in a super comprehensive way with all the examples available as codepens. Beside reading that book, i can recommend the presentation by Sara Soueidan on animating SVG with CSS.
Preparing the document
For the purpose of this tutorial, i recommend downloading the HTML Boilerplate. This document contains every bit of code to have your project smoothly run in all major, modern browsers. To get you up and running with this document, i recommend reading this excellent blogpost: An Introduction to HTML5 Boilerplate.
Creating the infographic:
Step 1: create all sections
Begin within the body element by creating all the segments required for your infographic using the infographic maker. In this instance, there are 11 sections, each featuring a unique background-color. The Flat UI color palette was selected for this purpose. Don’t forget to assign a class to every section, specifying the background-color within it.
- Section 1 – title – with background color
#3498db - Section 2 – animation sun – with background color
#2980b9 - Section 3 – animation earth – with background color
#1abc9c - Section 4 – animation fish – with background color
#16a085 - Section 5 – animation graph europe – with background color
#34495e - Section 6 – animation north-america – with background color
#2c3e50 - Section 7 – animation south-america – with background color
#f1c40f - Section 8 – animation africa – with background color
#f39c12 - Section 9 – animation asia – with background color
#9b59b6 - Section 10 – animation oceania – with background color
#8e44ad - Section 11 – footer – with background color
#ecf0f1
Step 2
Create the titles for each section
Once the sections are ready, start by giving each section a title and format the title, i used 2 Google fonts: Oswald for the titles and Open Sans for the text.
With Pulsetic you’ll be instantly notified the moment your website, API, or server becomes unavailable. Monitor uptime from multiple global locations and respond to incidents before your users are affected.
Create beautiful status pages in minutes to keep customers informed during outages and build trust with transparent communication.
Start Monitoring for FreeStep 3
Start creating the SVG’s
Before creating the graphics, make sure you have vector based software like Adobe Illustrator, Sketch or Inkscape to prepare your vector based artwork and export it to SVG. A good blogpost on how to do that, i recommend reading Dan Mall’s: SVG workflow for Designers by Dan Mall and SVG Files from Illustrator to the web.
You can export the elements from the software and save it as SVG. In case the code is not clean, use the online SVG optimiser by Peter Collingridge to clean your code before pasting it into the HTML.
Make sure to place your SVG code inside a block level element like a DIV. In case you want to make your SVG scalable, it’s important to have the code inside a DIV-tag so you can position the SVG inside this block.
I created a collection on Codepen Creating a scalable SVG infographic with a snippet of the rotating sun and the other snippets.
To make the SVG accessibility code better , i recommend reading these tips: Tips for Creating Accessible SVG by Léonie Watson.
Step 4
Drifting clouds
For the drifting clouds, i exported a graphic of 1 cloud as SVG and placed 2 instances of the cloud as SVG.
See the code on the codepen of the Drifting Clouds
Shortly explained: i created 2 instances of the same SVG cloud and placed a container around the svg to make sure they scale. Each cloud has its own class and is positioned absolute towards the container. Define the left and top position to start the cloud and a z-index to make sure they pop-up above the sun. Next define the animation called Drift and define the transform to translate X (or Y coordinates). To make sure the clouds drift from the beginning towards the edge, i set the start value to a negative pixel value and a 100% towards the end.
For all these examples, i used browser prefixes, but you can drop those while using a handy script like Prefix Free by Lea Verou. In Codepen you can drop those prefixes too and incorporate them in the profile settings.
Step 5
Rotating Earth with people
Animating the people
For the people around the globe, i first created a globe and 1 man in SVG. I created 16 instances of the man and rotated them around the globe. I animated each man. And rotated the globe with the same animation function Spin.
Step 6
Swimming fish in waves
For this animation, I used a SVG pattern to accomplish the wave effect. I wanted to give an impression of a sea with swimming fish in it. I created a separate SVG fish that moves around in the waves. Here’s the animation I used to accomplish this effect.
Step 7
The continents
Europe
For the continents, I exported from a world view the separate continents. The result in SVG is animated when hovered by giving the shape a stroke width. The same process is has been done for all the continents.
Step 8
The other continents
North-America, South-America, Africa, Asia and Oceania
For the other continents, the same approach has been done, export or save an SVG file for the continent and optimize this SVG using the online SVG optimizer. Next, paste the SVG code into your browser and add a class to the SVG. Style the same way with different fill and stroke colors.
Step 9
The animated donut graph
Animating the stroke
For the animation of the donut graph, I applied the code of an existing codepen, that you can view here. It’s important to note that for this animation to work, you’ll need to include jQuery library (jquery is included in the boilerplate).
I adapted the code to this:
The finished infographic
Defining what technologies to use
I’m aware that complex animations cannot or hardly be achieved with CSS3 animations. There are other libraries in Javascript that offer much more control and possibilities. My goal was to achieve an illustration with simple animations in SVG and I think the animations you can do with CSS are a great starting point to explore more. I have looked into Snap.io, a Javascript library to animate SVG with greater control.
Fallback for SVG and browser support
Use a PNG fallback
Create a PNG from the SVG infographic as a fallback. Read these steps on how to do this fallback: SVG Fallbacks. I recommend using the caniuse.com site to check browser support for the elements and properties.
Feedback
I hope you enjoyed this tutorial. If you have questions, suggestions or remarks, please do not hesitate to contact me. Thank you!
References
- HTML 5 Boilerplate
- MDN SVG Getting started using SVG
- Creating the donut graph animation
- FLAT UI
- The CSS Animations Pocket Guide by Val Head
- Modular CSS Animations – All The Right Moves Screencast by Val Head
- The magic of CSS by Adam Schwartz
- Prefix Free by Lea Verou
- Using a javascript library to animate SVG – Snap.svg
- SVG Fallbacks