5 UX KPIs You Need To Track
We love to measure things. It is our way to understand how good or bad something is. Although numbers don’t tell the whole story, they help evaluate the situation in a quick and easy manner. But can we measure user experience? Actually we can.
Although user experience efforts are directed toward improving the quality of user interactions and increasing overall satisfaction, which are qualitative outcomes, however, there is a need to quantify those efforts and measure their progress. UX KPIs are those measurements.
What is KPI?
Key Performance Indicators, also known as KPI, are quantifiable measurements that help an organization define and track the progress toward its goals.
KPIs that reflect the progress toward user experience related goals can be referred to as UX KPIs.
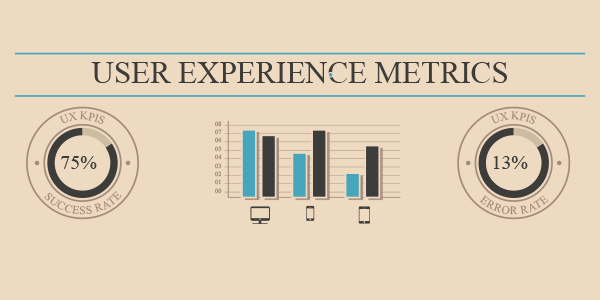
Main UX KPIs
User experience metrics are a bit different than metrics used in sales, marketing or finance, because they reflect human behavior and attitude. This kind of information is a bit difficult to turn into numbers, but on the other hand UX KPIs provide great insight into the size and magnitude of usability issues and help easily track their changes through time.
With Postcards Email Builder you can create and edit email templates online without any coding skills! Includes more than 100 components to help you create custom emails templates faster than ever before.
Free Email BuilderFree Email TemplatesUX design teams may choose to use two types of UX KPIs: quantitative and qualitative.
Quantitative UX KPIs
- Task success rate
- Time on task
- Use of search vs. navigation
- User error rate
- System Usability Scale (SUS)
Qualitative UX KPIs
- Reported expectations and performance
- Overall satisfaction
Let’s go through each of the metrics and see how we can measure them.
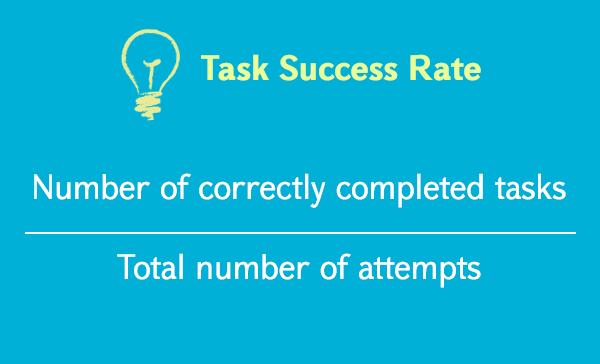
1. Task Success Rate
Also known as task completion rate, task success rate is the percentage of correctly completed tasks by users. This is probably the most commonly used performance metric that reflects how effectively users are able to completing certain tasks. As long as the task has a clearly defined goal or end point, such as completing a registration form, buying a certain product, etc we can measure the success rate. So before collecting data, it is important to define what constitutes success.
Although this metric says nothing about why users fail, it is a useful statistic.
It is also important to track the first-time users’ success rate and then track the progress: how the rate changes through time, when users gain more experience with the service. This will give you an understanding of system’s learnability, which is another indicator of user experience success. The higher task success rate, the better.
With Startup App and Slides App you can build unlimited websites using the online website editor which includes ready-made designed and coded elements, templates and themes.
Try Startup App Try Slides AppOther Products2. Time on Task
Time on task is sometimes referred to as task completion time or task time. This metric is basically the amount of time it takes the user to complete the task, expressed in minutes and seconds. Time on task data can be analyzed and presented in different ways, but the most common way is to present the average time spent on each task.
This can be a useful metric for diagnosing problems. But the time-on-task metric gives more insight in a dynamic view, when comparing the same metric for different iterations.
Generally, the smaller time-on-task metric, the better user experience.
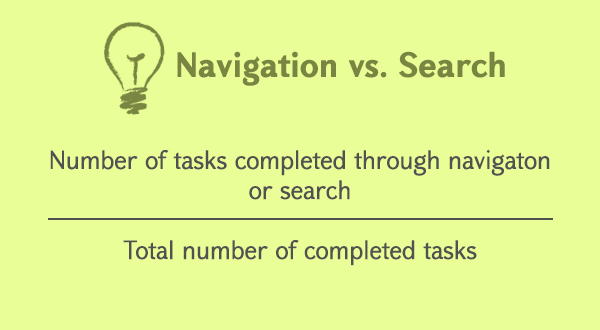
This is a valuable metric for evaluating the efficiency of information architecture and navigation. Usually when users try to find something through navigation and get lost, search is their final option.
So this metric can be tracked the following way. E.g. we can set up a usability task to find and purchase an item on an ecommerce website and track how many users used search and how many used navigation.
4. User Error Rate
Generally errors are a useful way of evaluating user performance. Errors can tell you how many mistakes were made, where they were made while interacting with the product, how various designs produce different frequencies and types of errors, and overall how usable something really is. Errors and usability issues are very closely related and even referred to as the same thing. Though usability issues are practically the source of user errors.
And by saying error we mean “user’s mistake,” e.g. entering web address in the IP address field. But again you need to clearly define what action constitutes a failure and whether partial failure is calculated as an error.
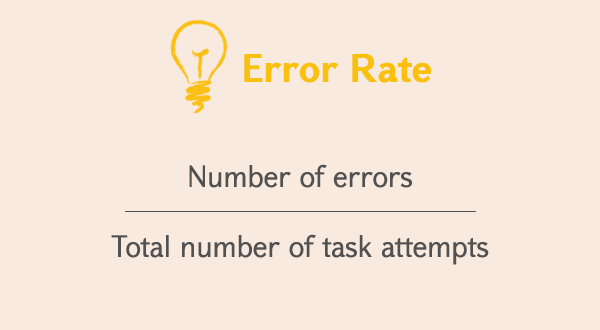
Error rate can be calculated in a few different ways depending on the number of error opportunities in a task and on what exactly you need to measure (e.g. a web form has as many error opportunities as there are fields in the form).
1. If the task has one error opportunity or there are many error opportunities but you would like to track only one of them, e.g. password field, the error rate calculation is as follows;
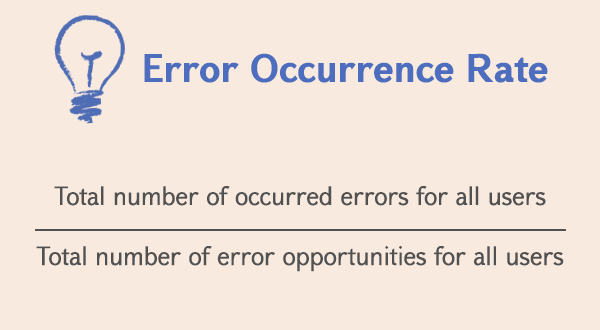
2. If there are multiple error opportunities per task, you may want to track the average error occurrence rate for all users;
Example: Five users have performed an online credit card payment. The task has seven error opportunities. Each of the users has made this many mistakes accordingly: 2, 4, 1, 2 and 3.
The average error occurrence rate for the online credit card payment task would be
(2+4+1+2+3)/7×5= 0.34 x 100 = 34%
5. System Usability Scale (SUS)
This is one of the most widely used tools for assessing the perceived usability of a product by a user. But this KPI is based on user survey and cannot be calculated simply based on statistical data. It requires user participation and can be used as a part of usability testing. SUS is a way to quantify the qualitative data, like user’s perceived satisfaction of the product. It consists of 10 statements to which users rate their level of agreement on a five-point scale.
For more information on aggregating, analyzing and presenting SUS data, you can refer to this template.
Qualitative KPIs
Qualitative information is generally more difficult to collect and as a rule it is more valuable and informative than raw numbers. So qualitative UX KPIs require communication with actual users through usability testing, contextual user interviews, at the very least user surveys.
This is much more time-consuming, requires more effort and cannot be measured with numbers. However, this kind of information has great value for any organization.
But out of the ocean of information you may get after a contextual user interview (think aloud protocol), you need to focus more on reported expectations and how users felt about the actual performance, as well as their overall satisfaction from using the service.
The System Usability Scale, discussed above, could also be a useful tool in the effort to quantify qualitative data.
Final Thoughts
UX KPIs are a great way to showcase the progress to shareholders and team members who are not necessarily UX professionals and numerical data is more comprehensible and easy to digest. With the help of UX metrics we are able to quantify that progress and calculate actual ROI of the usability changes performed the UX team, which is otherwise impossible.
Depending on the type of product or service, each team may choose to track different set of metrics and even define new, more specific KPIs that will help measure product UX more effectively. As long as those metrics are quantifiable and useful, you can go for them.