20 Useful CSS Graph and Chart Tutorials and Techniques
Usually, Graphs and Charts are mainly used for representing and organizing a set of numerical data with a graphical representation such as pie chart, line charts, bar graphs and many more. The static images would be reduced using these techniques and enables more access to the contents of the charts and the graphs. The Cascading Style Sheets (CSS) is a language that is used to describe the format of a document that is written in the markup language like HTML, XHTML, etc. The important feature of the CSS chart or graph is that it allows the users to easily download by reducing the bandwidth requirements of the HTML page.
There are numerous techniques involved which would create a style in the CSS3 graphs and charts. In any web industry, a good and excellent presentation of the data plays a major role in making the customers to understand the contents of your analysis. The professionalism should reflect in the data presentation and the viewers should be able to grasp the contents quicker. With the CSS3 charts or graphs, it is quite possible to present a decent data which could be quite descriptive and simple. The data’s should be convenient to compare effectively and the customers must conclude the right decision with the data presentation.
Slides: HTML Static Website Builder
Always remember, it is quite essential to establish a dynamic web chart so that the numerical data variables are quite easy to alter or could be updated at any time. Earlier, many web designers use flash to display their content on the web page, but presently, the graphic designers have started using the CSS graphs and charts, javascripts and php. It is highly interactive and beautiful when you create a pure CSS3 chart or graph. Though there are numerous methods to display your numerical data, one of the most professional and the easiest ways to visualize your data is with the CSS.
But in case you want your graphical representation to be displayed with fancy features, you could avail the Flash or the Java Script. The CSS based charts or graphs are quite simple to create and generate static harts and we could also style them according to our requirements. Depending on the customization and the level of flexibility you have, the price ranges vary drastically.
When you need to show just one number, you do not need to worry since one way or another user will notice it. However, when it comes to a range of numbers, things are getting confusing. Although digits easily stand out from the letters, nevertheless, this is not enough for extensive ranges: the more diverse data, the more difficult it to convey.
With Postcards Email Builder you can create and edit email templates online without any coding skills! Includes more than 100 components to help you create custom emails templates faster than ever before.
Free Email BuilderFree Email TemplatesTo make matters worse, when it comes to web interfaces and mobile applications, people prefer to scan rather than read. A massive block of information is always skipped, whereas small, carefully underlined extract gets overall attention. On top of that, users do not want to waste their time on exploring statistics. After all, it is boring. However, there is a way out. To spoon-feed the data to the users and drive home the right message, you can use free CSS graphs and free CSS charts.
CSS graphs and CSS charts are real lifesavers when it comes to illustrating the content. The deal is people infer meaning from pictures quicker than from text. Besides, visuals always draw attention. Therefore, thanks to a clear structure and beautiful style, users easily step back, look at the broad picture, understand your content within seconds, and actually enjoy the experience.
Let’s take a deep dive into the basics of free CSS graphs and CSS charts, and find out how to create them from scratch following helpful tutorials to turn bulk of data into an engaging story.
CSS Graphs and CSS Charts: Essentials
Pros of Using Free CSS Graphs and Free CSS Charts
Presenting data in a snackable format is not the only advantage of free CSS graphs. There are some more good advantages of using properly structured data whose meaning is visualized right before your eyes. For instance,
- Users can manage multiple sources effectively.
- Users can easily take out key insights.
- Users can quickly analyze and communicate results.
- Users can easily make predictions for future outcomes.
- There is no overwhelm and frustration in processing the bulk of data.
- It is a better way for your audience to understand your argument.
- It is a handy comparison of classified data.
- It skillfully illustrates the relationships between objects.
- The dynamic elements can be used for creating a great storytelling experience.
- The additional information can be hidden in interactive tooltips so that CSS charts can cover an ample bulk of data.
- It is a surefire way to hold viewers’ attention.
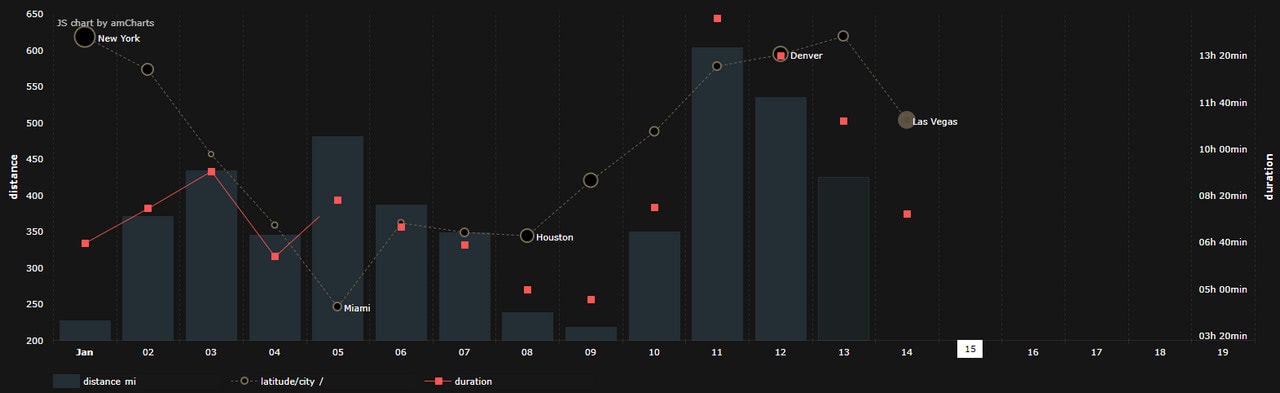
CSS Animations by amCharts
Types of Charts
You can present data in various formats and ways. For instance, it may appear as bars, lines, dots, boxes, bubbles. It can be connected or, on the contrary dispersed. You can use colors, patterns, and other graphical instruments to visualize it. Therefore, free CSS graphs and CSS charts come in various shapes. The most popular are:
- Histogram,
- Bar chart,
- Pie chart,
- Line chart,
- Timeline chart,
- Organizational chart,
- Tree chart,
- Flow chart,
- Area chart,
- Cartogram,
- Pedigree chart,
- Sunburst Chart,
- Bubble chart,
- Polar area diagram,
- Waterfall chart,
- Radar chart,
- Treemap,
- Streamgraph,
While these types are undoubtedly popular in the real world, when it comes to web design, things are a bit different. As a rule, the most common ones in this area are:
- stacked column charts,
- bar charts,
- pie charts,
- bubble charts,
- doughnut charts,
- line charts,
- area charts,
- scatter charts,
- interactive maps,
- 3D charts.
Each type has its pros and cons. Therefore, they reveal their potential only when used with a proper kind of data.
With Pulsetic you’ll be instantly notified the moment your website, API, or server becomes unavailable. Monitor uptime from multiple global locations and respond to incidents before your users are affected.
Create beautiful status pages in minutes to keep customers informed during outages and build trust with transparent communication.
Start Monitoring for FreeFor example, column charts are great for showing numerical comparisons between categories and classified data; they can be vertical and horizontal.
Pie charts are great for showing individual dimensions and comparing parts of a whole; it works great for data based on a single variable.
Line charts are great for showing trends across continuous measurements; lines move up and down, indicating changes either positive or negative.
To choose the proper variant, you need to consider such parameters as
- type of metrics,
- the total number of variables,
- data points,
- the period of data,
Finally, yet importantly, free CSS charts also can be static, dynamic, and interactive. People love everything animated. However, when it comes to presenting the bulk of data, too many effects may ruin everything. Therefore, exercise caution when you choose interactive features. Always set data as a top priority and test your free CSS graphs to see whether the people get the best user experience or not.
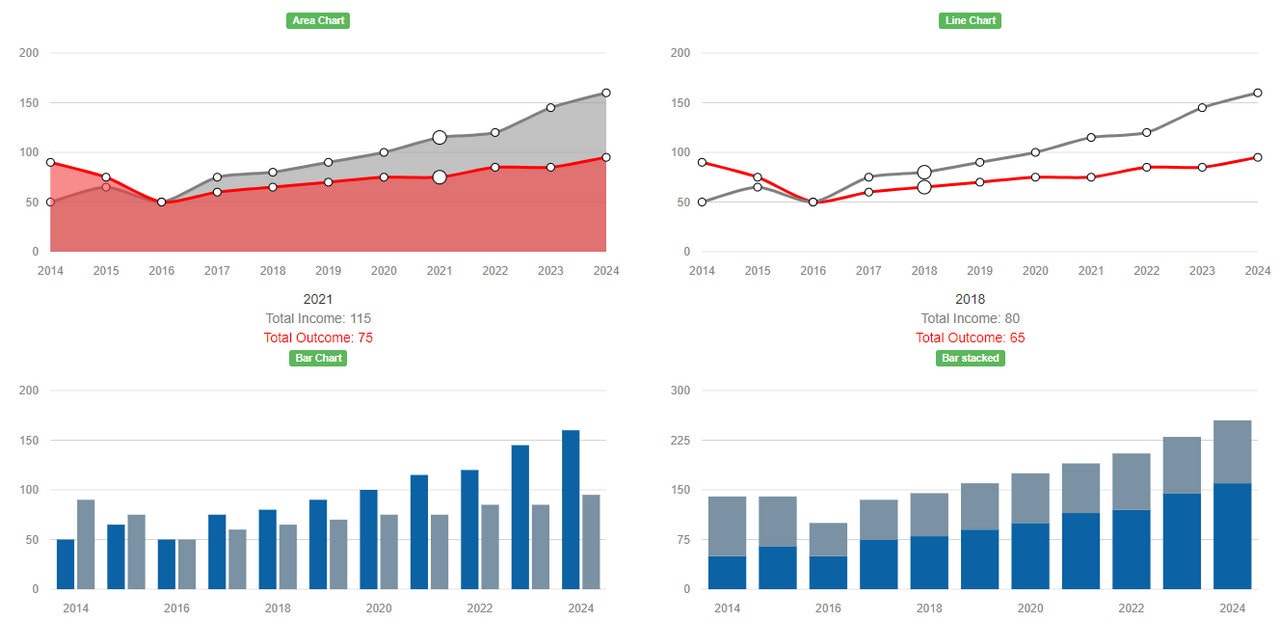
CSS charts by Cioban Andrei
Essential Features of CSS Graphs and CSS Charts
To let the free CSS chart serve its mission, aka dividing the considerable volume of data into easily digestible portions, it should have all essential elements such as
- The title is a short description that characterizes the CSS graph.
- The horizontal and vertical axis that define periodic graduations. As a rule, they are used in column CSS charts.
- Numerical and categorical indicators.
- Used to describe axis and additional elements that may look confusing. They also show units of indications used in the axis. What’s more, they can also associate position in the CSS graph or clarify things.
- Not all CSS charts have it; however, some of them heavily rely on it. As a rule, it makes visual alignment of data handy and comprehensible.
- It identifies the variable.
Not all free CSS graphs need all these elements; however, it is highly recommended to have at least title, labels, and legends.
Sphere of Usage
In the web, free CSS charts and CSS graphs are used not only in content. They are frequent guests of
- dashboards;
- admins;
- mobile applications, especially those that are in finance, cryptography, banking, and other business sectors;
- infographics;
- hero areas;
- landing pages;
- online presentations;
- personal portfolios;
- eCommerce;
- saas;
- news portals.
What’s more, modern CSS charts are no longer tools only for visualizing data. They are used for promoting and advertising as well. For instance, standalone artists use them to promote their skills; e-commerce platforms employ them to compare and contrast features of products that help to foist goods, and web agencies create infographic-based websites to entertain people and show off.
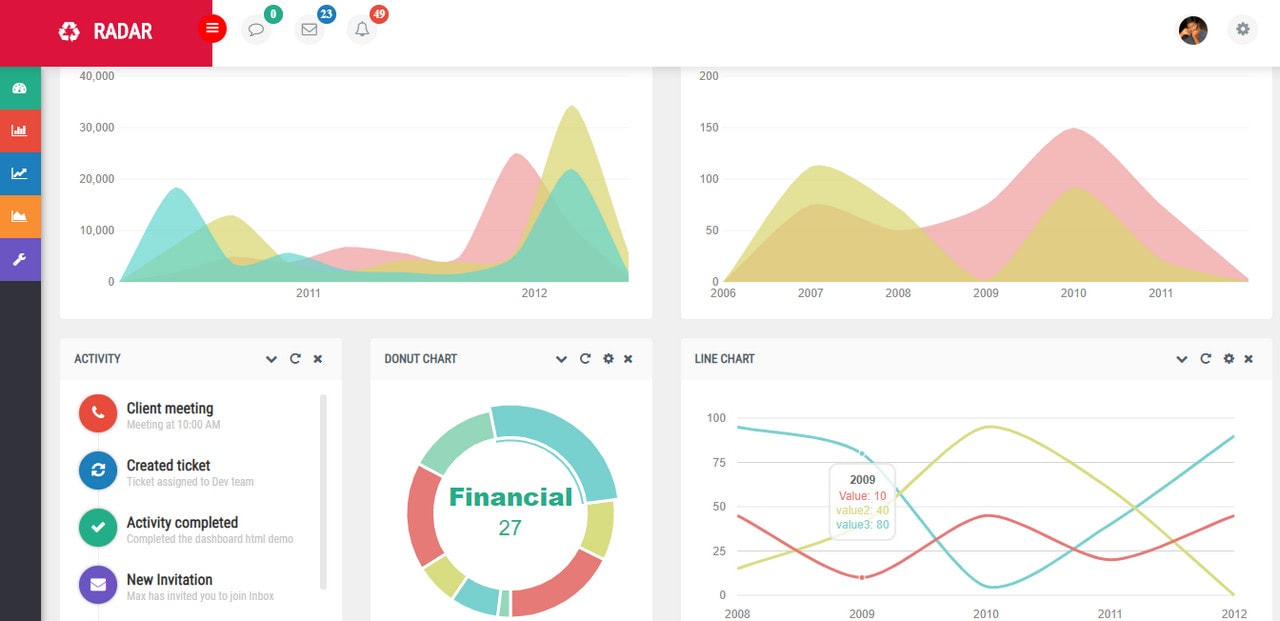
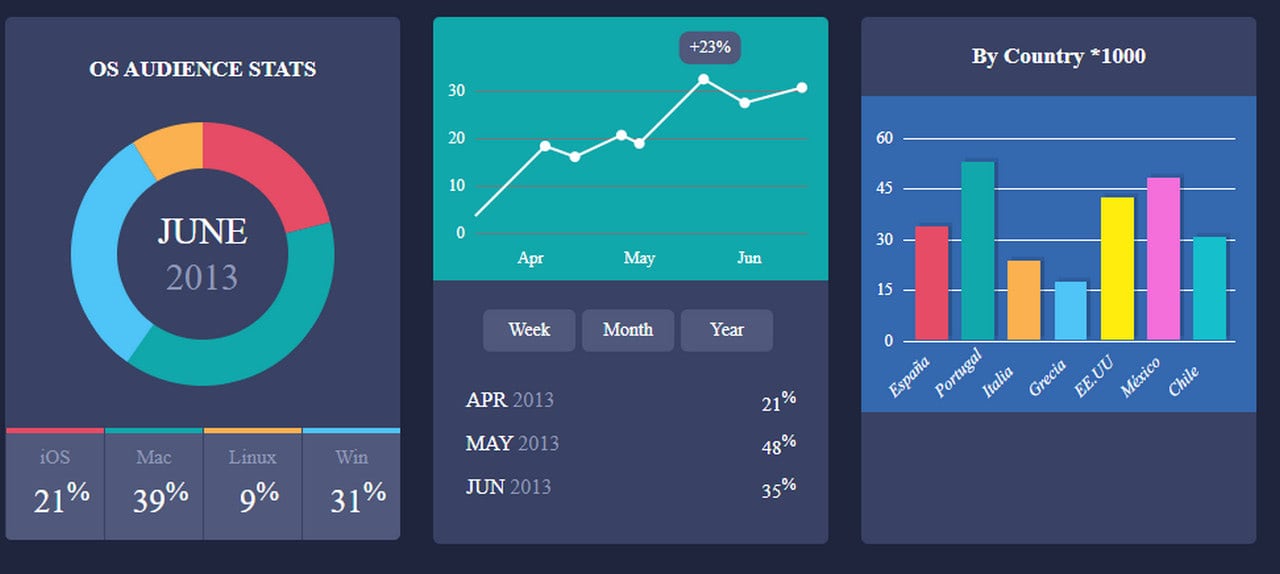
Dashboard by Sathish kumar
How to Create a CSS Chart – Basic Routine
Whatever CSS graph you need to create, whether it is a web version or graphical version for your startup presentation, to achieve the best result, you need to follow these five steps.
- Gather your information.
- Determine the type of chart. Is it an organizational CSS graph that is ideal for infographics or a numerical one that is used in dashboards and admins?
- Determine whether it will be static or interactive.
- Determine whether it will be generated dynamically from the live data, or you are going to build it from static data.
- Create an actual CSS graph. Here you can go two ways. The first one implies the utilization of third-party solutions like online services and specific JavaScript libraries that offer pre-made templates. The second one suggests creating everything from scratch that is ideal for custom and brand-tailored solutions.
Best Practices to Make a Killing CSS Graph
To unleash the potential of free CSS charts, follow these best practices:
- Correctly define the type of CSS graph that you need. For example, do not use circle graphs for showing patterns or changes over time. Instead, use a line graph with exact numerical values.
- Be careful when you need to show similar data values. Not all CSS charts are capable of dealing with this gracefully. For instance, circle graphs fail to deliver the distinction.
- Add no more than 6-8 variables to one chart, especially to pie charts since too many wedges may confuse viewers.
- Simplify color differentiation. It is better to use tones of the same color for the same group or class of data. For diverse groups, you can use contrast colors since the brain is quick to notice it. The simple way out is to create a gradation from dark to light tones. If you need to set focuses or prioritize some points, you can always refer to color psychology and apply some tricks to direct the attention towards the important things.
- Make a CSS chart accessible. Like any other element of the user interface, it should be available to all people.
- Make the CSS graph responsive and mobile-friendly to let it accommodate all the popular devices and hold consistency no matter what.
- Make it browser compatible. If you create it from scratch, make sure you use CSS features that are widely supported, and the free CSS chart is correctly rendered across all boards.
- Make it lightweight. Do not overload your website with excessive plugins and libraries.
- Make it quick. Performance is critical. Data should be loaded quickly. If you cannot afford a fast connection and speed, make sure you provide good response for that. For instance, you can use a loader to notify about the delay.
- Make it interactive. Hotspots, tooltips, pop-ups, and other dynamic features like hover effects and mouse-triggered animations may transform data perception into an actual storytelling experience that makes exploration engaging and impression long-lasting.
- Structure your datasets in a clear order. You can arrange data clockwise or decreasing order from left to right (in RTL countries from right to left correspondingly).
- Label graph with a head title, legend, and short descriptive sentence to avoid confusion. However, do not clutter the design with too many labels. Stick to a clean and minimal layout and ditch all the excess details. The rule of thumb, if the information is obvious, it does not require a label.
- Animate data. Start with baby steps. Add a hover effect to focus the user’s attention on selected data unobtrusively.
- Stick to one font, though use various weights. The bold version is excellent for the title, headings, and subheadings, whereas the light version is ideal for the legend, data labels, and body content.
- Experiment with size to make it easy to tell the trends or data points apart across all sizes.
- Make the chart as simple as possible. If you cannot do it, then divide data into several groups and create a CSS chart for each one.
Pure CSS Charts by Kseso
3 Popular Ready Solutions for Creating Free CSS Graphs and Free CSS Charts
Ready solutions are fast ways to yield great looking and dynamic results. Although most of them require basic technical skills, they still can be easily handled. There are numerous solutions in the wild, but we have covered just three of them to give you a simple notion of what they can do.
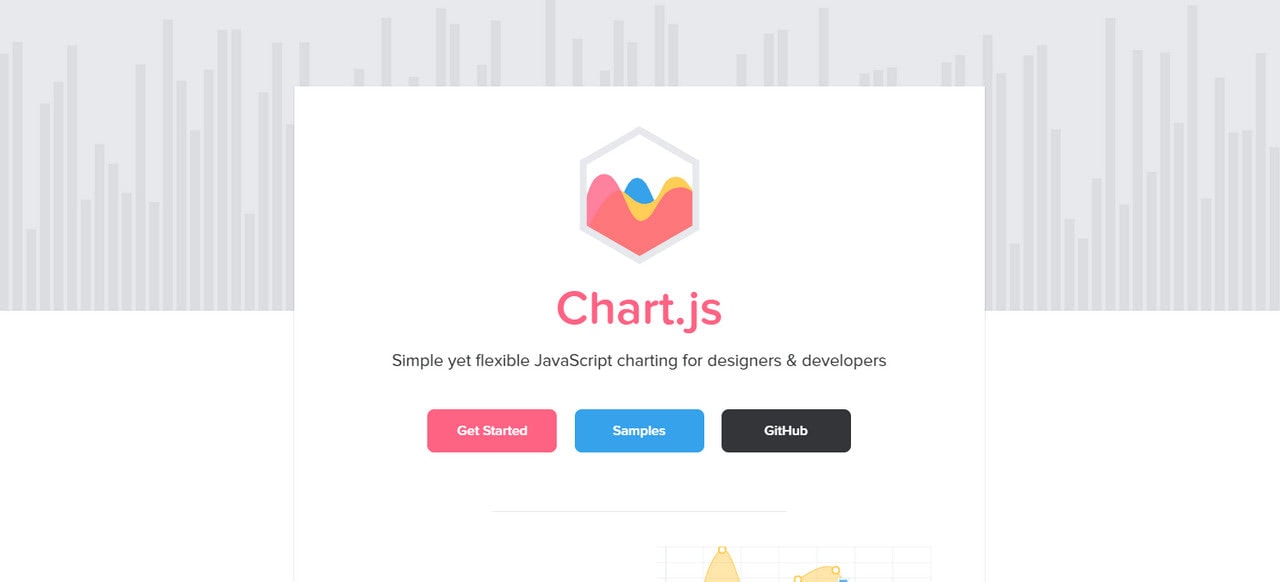
You do not need any crafty HTML skills to handle Chart.js, since it is a pure joy to use. Not only has the team provided clear instructions, but they have also made syntax intuitive and handy.
The library includes eight free CSS chart types that are fully responsive and powered by modern HTML5 technologies. Each one is easily customizable so that you can restyle the positioning, size, shape, and design of data. And, each one can be animated to produce a marvelous user experience: use variables to set the type and delay of animation.
Simple yet effective solution.
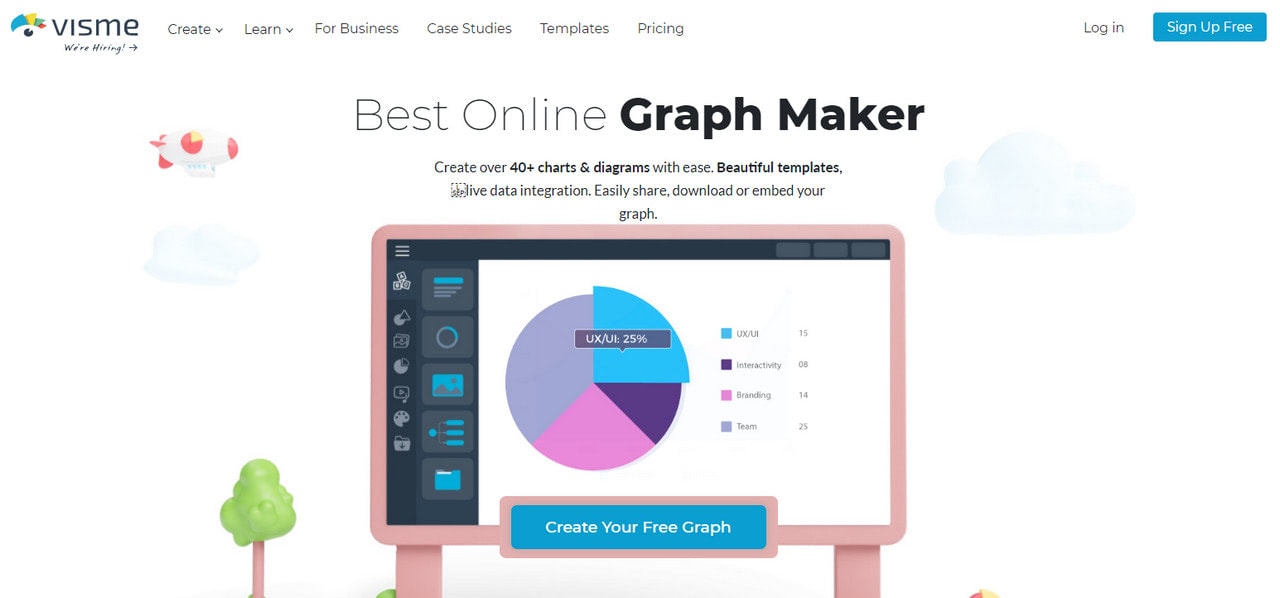
Visme
This is another treat to handle. It is a handy platform for non-tech-savvy people to bring their wild ideas to life without any coding skills.
It is a professional tool with lots of aces in the hole. For starters, it has numerous stylish templates and more than 40 types of diagrams and charts. Since the team has put a prime focus on design and usability, these free CSS graphs are well executed and look sleek and elegant.
Finally, yet importantly, one of the main features is that it supports live data integration. Therefore, you can create dynamic CSS charts with regularly updated data that is super handy for all platforms and dashboards that should provide up-to-date information.
Chart.css is one of the oldest solutions for creating free CSS graphs and free CSS charts on the web. Although it includes just a bar graph, nevertheless, it is a time-tested and cost-effective solution for real-world applications.
Its key feature lies in lightness. If you want a simple CSS chart with a beautiful design that will not slow down the performance of the website, then it is right for you. The only drawback is that unlike the previous example, it requires techy skills. Sadly, to customize everything, you need to code. What’s more, if you need a version tailored to your brand, then you need to style everything with CSS from scratch. Though, if you are a developer, this is not an issue.
Collection of Free CSS Graph and Free CSS Chart Tutorials and Techniques
If you need something more tailored and at the same lightweight not to overload the website, you can create everything from scratch. Sound scary? Well, no worries, we have got you covered.
We have assembled a useful collection of free CSS graph and free CSS chart tutorials and techniques. You can find the best option for your project and learn something new since when the developer breaks down his or her process, it is always enlightening and inspiring.
How to Create an Interactive Graph using CSS3 & jQuery

Although the tutorial is targeted at advanced audience that not only have basic knowledge of jQuery and CSS but also can boast of some experience, yet if you are eager to spend a couple of extra hours then you will be able to get to the bottom of the presented technique. The more so, the tutorial demonstrates how to put into practice Flot plugin and achieve outstanding results.
CSS3 Charts

It’s an article-summary by Smashing Magazine, whose team held the contest to stimulate designers to pushing their boundaries in terms of CSS3 utilization. It lightens up winners. Thus, the first place was taken by Sean Oh, who created an intuitive interface for composing colorful charts.
Wicked CSS3 3d bar chart

How about making the previous chart look even more eye-catching and engaging? The Marcofolio offers another unconventional solution that implies building 3d dimensional bars. Much like the last time, the whole effect is achieved only with the help of CSS3 and HTML.
Data Visualization: Flexible Bar Graphs using CSS

The tutorial unveils a time-tested way of visualizing data through flexible bar graphs that neatly separate each bulk of data from another. The artist uses different colors for laying accents and highlighting the difference.
CSS Stacked Bar Graphs

Demonstrates another professionally crafted interpretation of bar chart that displays data as a stack and with overlapping elements. Just by using a proper HTML markup and CSS styling you will be able to provide the component with the axis, grid, and all other essential elements.
Creating Pie Charts with CSS3

Let’s move from the linear type of graphs to the circular type of graphs such as pie charts. The tutorial by Atomic Noggin shows how to create one of that kind just by using modern CSS features such as border-radius, clip, and transformations. Moreover, it shows how to add an info box and colorize each part into a different tone.
Accessible Data Visualization with Web Standards

The team shows an interesting solution that leverages ’em’ measurement for adding adaptiveness, and semantic class names. There are code snippets of a horizontal bar chart, timeline chart, and sparklines.
Creating a graph

Russ Weakley tells how to create a basic, pretty primitive yet intelligible timeline chart with the help of CSS and percentage background images. You can easily prettify and refine the solution through manipulating with CSS styles.
List bar chart
The tutorial includes a basic explanation of how to style a definition list and convert it into a timeline chart. The solution is based on a clean solid color backdrop, flat elements, and neat grid structure.
An accessible bar chart

As the title suggests, the key feature of this graph lies in its accessibility. It is a small article that comprises only a short piece of CSS code. However, it can be easily adapted to your needs. For creating bars, the developer employs images, though it is not so elegant yet quite effective.
CSS3 Graph Animation

Until now we have considered tutorials and articles with static solutions. It is time to take a look at a basic technique of creating animated graphs. Alessio Atzeni delves into CSS3 possibilities and brings to life a dynamic bar chart with the help of transformation features.
CSS3 Bar Graphs

It’s a premium tool for presenting data through 3d bar charts. The feature list comprises:
- 9 predefined graphs (including both single and grouped bar charts),
- hover states,
- helpful documentation,
- a full support of all modern browsers, except for IE8 and lower.
All the customization can be done through HTML and CSS files.
CSS3 bar charts
As the title of the article states, you are going to get to know how to implement the latest CSS3 techniques and progressive enhancements to make your data look less boring and more appealing. It has been tested in various browsers and is suitable for most versions.
Animated wicked CSS3 3d bar chart

The developer shares with readers an original and creative solution. It is a fully illustrated vertical bar chart that reacts on user’s action and is supplied with some smooth transitions for a better experience. As usual, it is based on pure CSS3. Nevertheless, at the end of the article you can also find a JS-powered version.
A Snazzy Animated Pie Chart

This is another advanced tutorial in our collection that requires good knowledge in HTML5, CSS3, and jQuery. The developer shows how to create an animated pie chart using canvas elements, sophisticated styling and some help from ExplorerCanvas libraries.
How to Create Pie Charts with CSS3

The article describes an excellent way of presenting data through a vibrant pie chart that can come in handy in various cases. Although the approach is quite primitive and is based on a pure combination of HTML and CSS, yet it is more than enough to visualize stats and not overload project.
Conclusion
Although the Web offers lots of different ready-to-be-used plugins for visualizing data such as Chart.js or Plotly.js, yet sometimes there are situations when simple code snippets are more appropriate.
For example, when you need just one tiny lightweight chart for completing your online resume or an animated pie chart for demonstrating stats of your project. The more so, nowadays creating one from a scratch is not rocket science and the listed above tutorials are excellent proves of that. They gently guide you through the whole routine and provide with excellent infographic-inspired components.
Condense large amounts of data into an easy to understand format can be a challenge. However, nothing is impossible with the right tools at the fingertips. All you need is time-tested and crowd-proven CSS graphs and CSS charts that deal with this situation gracefully.
Not only do they present information in easily digestible portions, but thanks to modern CSS3 techniques and JavaScript tricks, they also create an unforgettable experience that makes the perception of the bulk of data pleasant and memorable.